本記事3行要約:
● CVPR2024でも昨年超えの過去最多2,716件の論文が採択された
● 日本人研究者からの発表件数も最多更新で66件(のべ130名)
● 出現キーワードでは3D、Diffusion、Video、Generationが多数
トップカンファレンス定点観測シリーズ vol.13、「CVPR」の第4弾です。
これまでResearchPortでは、コンピュータビジョン分野で最高峰の会議であるCVPR(IEEE/CVF Conference on Computer Vision and Pattern Recognition)における論文投稿数の増加とそれに伴う盛況感について2021・2022・2023年(速報)版を記事にしてきました。
*参照:
「CVPR」ResearchPortトップカンファレンス定点観測 vol.1
「CVPR2022」ResearchPortトップカンファレンス定点観測 vol.3
「CVPR2023-速報-」ResearchPortトップカンファレンス定点観測 vol.9
今年も6月となりCVPR2024が開催されます。
以前からの最多論文数更新は今年度も変わらず、日本からの発表も伸びております。本会議が開催される直前に、速報記事*1として統計情報をまとめました。
CVPR2024 開催概要
▶ 開催期間: 17-21 Jun., 2024
▶ 開催都市: Seattle, WA, USA
▶ 公式HP: https://cvpr.thecvf.com/Conferences/2024
*1 2024年6月12日時点
■CVPR2024総括
前年同様、CVPR2024でも投稿数・採択数ともに過去最高数を更新しております。投稿数は10,000件を大幅に超えており、5年前の2019年大会の2倍以上と驚異的な数字の伸びをみせております。
詳細は以前の記事を参照していただきたく、早速本題に入りたいと思います。CVPR2024最新数値含めて以下の表1・図1に示しております。
| Year | #papers | #orals | #submissions | acceptance rate | oral acceptance rate | Venue |
|---|---|---|---|---|---|---|
| 1996 | 137 | 73 | 551 | 24.86% | 13.25% | San Francisco,CA |
| 1997 | 173 | 62 | 544 | 31.80% | 11.40% | San juan,Puerto Rico |
| 1998 | 139 | 42 | 453 | 30.68% | 9.27% | Santa Barbara,CA |
| 1999 | 192 | 73 | 503 | 38.17% | 14.51% | Fort Collins,CO |
| 2000 | 220 | 66 | 466 | 47.21% | 14.16% | Hilton Head,SC |
| 2001 | 273 | 78 | 920 | 29.67% | 8.48% | Kauai,HI |
| 2002 | – | – | – | – | – | – |
| 2003 | 209 | 60 | 905 | 23.09% | 6.63% | Madison,WI |
| 2004 | 260 | 54 | 873 | 29.78% | 6.19% | Washington,DC |
| 2005 | 326 | 75 | 1,160 | 28.10% | 6.47% | San Diego,CA |
| 2006 | 318 | 54 | 1,131 | 28.12% | 4.77% | New York,NY |
| 2007 | 353 | 60 | 1,250 | 28.24% | 4.80% | Minneapolis,MN |
| 2008 | 508 | 64 | 1,593 | 31.89% | 4.02% | Anchorage,AK |
| 2009 | 384 | 61 | 1,464 | 26.23% | 4.17% | Miami,FL |
| 2010 | 462 | 78 | 1,724 | 26.80% | 4.52% | San Francisco,CA |
| 2011 | 436 | 59 | 1,677 | 26.00% | 3.52% | Colorado Springs,CO |
| 2012 | 463 | 48 | 1,933 | 23.95% | 2.48% | Providence |
| 2013 | 471 | 60 | 1,798 | 26.20% | 3.34% | Portland,OR |
| 2014 | 540 | 104 | 1,807 | 29.88% | 5.76% | Columbus,OH |
| 2015 | 602 | 71 | 2,123 | 28.36% | 3.34% | Boston,MA |
| 2016 | 643 | 83 | 2,145 | 29.98% | 3.87% | Las Vegas,NV |
| 2017 | 783 | 71 | 2,680 | 29.22% | 2.65% | Hawaii,HW |
| 2018 | 979 | 70 | 3,359 | 29.15% | 2.08% | Salt Lake City,UT |
| 2019 | 1,294 | 288 | 5,160 | 25.08% | 5.58% | Long Beach,CA |
| 2020 | 1,466 | 335 | 5,865 | 25.00% | 5.71% | Seattle,WA |
| 2021 | 1,660 | 295 | 7,015 | 23.66% | 4.21% | Nashville,TN |
| 2022 | 2,063 | 342 | 8,161 | 25.28% | 4.19% | New Orleans, LA |
| 2023 | 2,357 | 247 | 9,155 | 25.75% | 2.70% | Vancouver, Canada |
| 2024 | 2,716 | 324 | 11,532 | 23.55% | 2.81% | Seattle,WA |
表1 CVPR論文投稿数および採択率
* 2023年のoralはhighlightsとaward candidateを合わせた件数です。
* 出典:https://cvpr.thecvf.com/Conferences/2024/AcceptedPapers
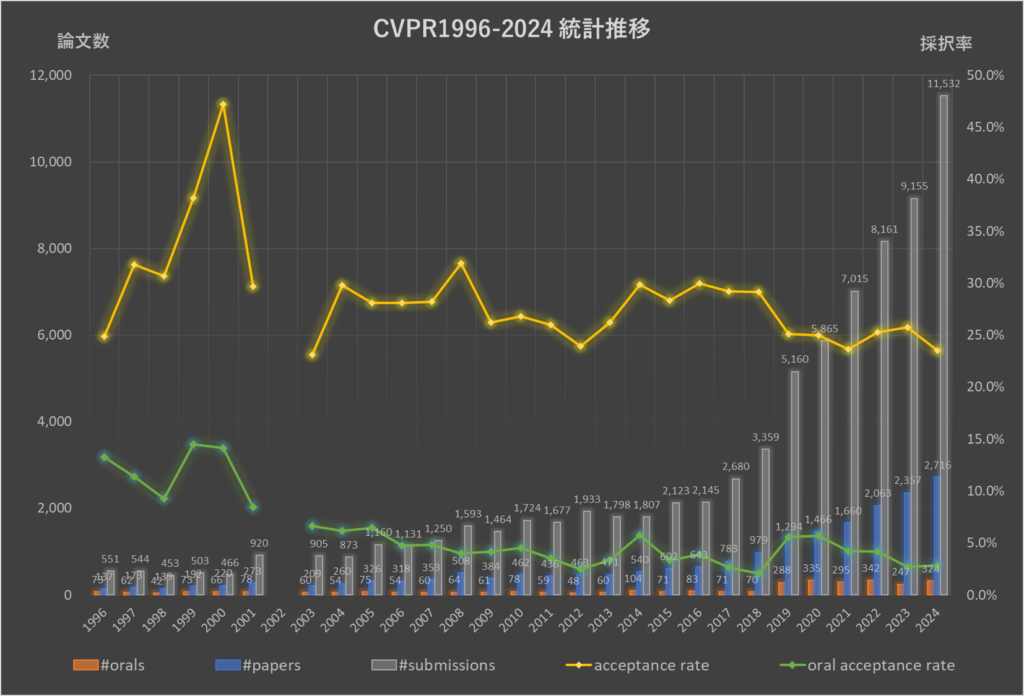
今年は、11,532件の論文が投稿され、2,716件*2が採択されました。採択率は23.55%で、このうち324件が口頭発表論文(oral)ですので、oral採択率は2.81%となります。
査読が崩壊しているという話も聞かれるものの、論文数は順調に伸びており、コミュニティが成長・拡大していることが窺えます。
[CVPR2024 統計]
・論文投稿数: 11,532件
・採択数: 2,716件(うちoral採択 324件)
・採択率: 23.55%
・oral採択率: 2.81%
*2 websiteでは2,719件と書かれていますが、proceedingsでは2,716件でしたので取り下げ等があったと判断し2,716件を採用しています。
■日本人研究者の活躍
恒例となりました、日本人著者の比率も調べておりますので、結果を表2に示します。
全著者数(15,288名)に占める日本人の割合は、2024年において0.85%となっております。
著者比率自体は昨年より低下しておりますが、日本人著者数は年々増加傾向となっており、国内コンピュータビジョン研究の盛況が感じられる数字ではないでしょうか。
一方、「日本人著者を含む論文数」は年々微増しておりますが、全論文の伸びには追いついておらず「日本人著者が絡む論文比率」でみると減少傾向となっています。
| 開催年 | 論文数 | 著者数 | 平均著者数 | 日本人 著者数 |
日本人 著者比率 |
日本人著者 を含む論文 |
日本人著者が 絡む論文比率 |
|---|---|---|---|---|---|---|---|
| 2014 | 540 | 1,881 | 3.48 | 45 | 2.39% | 26 | 4.81% |
| 2015 | 602 | 2,207 | 3.67 | 33 | 1.50% | 20 | 3.32% |
| 2016 | 643 | 2,487 | 3.87 | 45 | 1.81% | 21 | 3.27% |
| 2017 | 783 | 3,185 | 4.07 | 61 | 1.92% | 29 | 3.70% |
| 2018 | 979 | 4,214 | 4.30 | 93 | 2.21% | 38 | 3.88% |
| 2019 | 1,294 | 5,863 | 4.53 | 86 | 1.47% | 40 | 3.09% |
| 2020 | 1,466 | 6,970 | 4.75 | 65 | 0.93% | 38 | 2.59% |
| 2021 | 1,660 | 8,087 | 4.87 | 72 | 0.89% | 42 | 2.53% |
| 2022 | 2,063 | 10,874 | 5.27 | 108 | 0.99% | 52 | 2.52% |
| 2023 | 2,357 | 12,722 | 5.40 | 117 | 0.92% | 60 | 2.55% |
| 2024 | 2,716 | 15,288 | 5.63 | 130 | 0.85% | 66 | 2.43% |
表2 CVPR投稿論文全体の著者数に占める日本人比率の推移
| 著者 | 採択数 |
|---|---|
| Shunsuke Saito |
4
|
| Koki Nagano |
3
|
| Ko Nishino |
3
|
| Kiyoharu Aizawa |
2
|
| Hiroyasu Akada |
2
|
| Yuki Asano |
2
|
| Yasunori Ishii |
2
|
| Yasuyuki Matsushita |
2
|
| Hajime Nagahara |
2
|
| Shohei Nobuhara |
2
|
| Fumio Okura |
2
|
| Hiroaki Santo |
2
|
| Yoichi Sato |
2
|
| Takafumi Taketomi |
2
|
| Norimichi Ukita |
2
|
| Toshihiko Yamasaki |
2
|
| Takayoshi Yamashita |
2
|
| Kazuki Adachi |
1
|
| Daiki Chijiwa |
1
|
| Yuki Endo |
1
|
| Kenji Enomoto |
1
|
| Yuto Enyo |
1
|
| Toshiaki Fujii |
1
|
| Ryo Fujita |
1
|
| Kent Fujiwara |
1
|
| Koki Fukai |
1
|
| Yasutaka Furukawa |
1
|
| Ryosuke Furuta |
1
|
| Shuji Habuchi |
1
|
| Kenji Hata |
1
|
| Yusuke Hirota |
1
|
| Yuto Horikawa |
1
|
| Daichi Horita |
1
|
| Tomoki Ichikawa |
1
|
| Satoshi Ikehata |
1
|
| Kei IKEMURA |
1
|
| Tetsugo Inada |
1
|
| Naoto Inoue |
1
|
| Naoya Iwamoto |
1
|
| Kenji Iwata |
1
|
| Sekitoshi Kanai |
1
|
| Yoshihiro Kanamori |
1
|
| Kanta Kaneda |
1
|
| Takuhiro Kaneko |
1
|
| Hisashi Kashima |
1
|
| Hirokatsu Kataoka |
1
|
| Kenji Kawaguchi |
1
|
| Kazuhiko Kawamoto |
1
|
| Hiroaki Kawashima |
1
|
| Hiroshi Kera |
1
|
| Kotaro Kikuchi |
1
|
| Akisato Kimura |
1
|
| Takumi Kobayashi |
1
|
| Satoru Koda |
1
|
| Takashi Matsubara |
1
|
| Hidenobu Matsuki |
1
|
| Fumiya Matsuzawa |
1
|
| Hajime Mihara |
1
|
| Yu Mitsuzumi |
1
|
| Ikuya Morikawa |
1
|
| Yusuke Moriuchi |
1
|
| Riku Murai |
1
|
| Yuzuru Nakamura |
1
|
| Yuta Nakashima |
1
|
| Chihiro Nakatani |
1
|
| Hideki Nakayama |
1
|
| Koichiro Niinuma |
1
|
| Kento Nishi |
1
|
| Takeru Oba |
1
|
| Masatoshi Okutomi |
1
|
| Taishi Ono |
1
|
| Mayu Otani |
1
|
| Takashi Otonari |
1
|
| Daichi Saito |
1
|
| Hiroki Sakuma |
1
|
| Takami Sato |
1
|
| Shogo Sato |
1
|
| Hiroyuki Sato |
1
|
| Satoshi Sato |
1
|
| Ryosuke Sawata |
1
|
| Hiroyuki Segawa |
1
|
| Takayuki Shimizu |
1
|
| Kaede Shiohara |
1
|
| Takahiro Shirakawa |
1
|
| Takaaki Shiratori |
1
|
| Kota Sueyoshi |
1
|
| Akihiro Sugimoto |
1
|
| Komei Sugiura |
1
|
| Kosuke Sumiyasu |
1
|
| Keita Takahashi |
1
|
| Tsubasa Takahashi |
1
|
| Ryuhei Takahashi |
1
|
| Ryuichi Takanobu |
1
|
| Hikari Takehara |
1
|
| Masato Taki |
1
|
| Towaki Takikawa |
1
|
| Yusuke Takimoto |
1
|
| Mikihiro Tanaka |
1
|
| Masatoshi Tateno |
1
|
| Masayoshi Tomizuka |
1
|
| Chihiro Tsutake |
1
|
| Seiichi Uchida |
1
|
| Takeshi Uemori |
1
|
| Yuiga Wada |
1
|
| Nobuhiko Wakai |
1
|
| Takuma Yagi |
1
|
| Kota Yamaguchi |
1
|
| Shunsuke Yasuki |
1
|
| Ryoma Yataka |
1
|
図2 CVPR2024 日本人研究者個人別採択件数
■論文出現キーワードの推移
最後に、論文タイトルに含まれるキーワードの比率も、調査いたしました。
昨年同様、“Diffusion(拡散モデル)”がトレンドキーワードとして挙がっていることが分かります。また3DやVideoなど多様なモダリティが昨年に続き注目を集めています。加えて、生成(Generation / text to image)やセグメンテーション(segmentation)など、密(Dense)な出力タスクが多く、より難易度の高いタスクに関する研究が進んでいることも見て取れます。
また特筆すべき点として、“言語モデル(language-model / LLM)”というキーワードが昨年に比べて著しく増加しており、ビジョンタスクの言語モデルとの融合や、学習時のおける活用が増えていることも分かります。
Datasetなどのキーワードも多く、今まで変わらずデータセットや問題設定における貢献も重要視されていることも伺えます。
| 2022 | 2023 | 2024 | |||
|---|---|---|---|---|---|
| learning | 12.92% | learning | 13.39% | 3d | 13.14% |
| transformer | 9.50% | 3d | 10.97% | diffusion | 12.04% |
| video | 8.97% | video | 8.80% | learning | 8.91% |
| 3d | 8.73% | transformer | 6.38% | video | 8.73% |
| object detection | 4.58% | object detection | 4.29% | generation | 5.82% |
| detection | 4.39% | diffusion | 4.21% | transformer | 4.09% |
| estimation | 4.24% | estimation | 4.08% | segmentation | 3.83% |
| graph | 3.76% | representation | 3.82% | detection | 3.61% |
| self supervis | 3.71% | detection | 3.66% | estimation | 3.42% |
| segmentation | 3.62% | point cloud | 3.49% | language model | 3.39% |
| representation | 3.09% | generation | 3.36% | reconstruction | 3.09% |
| semantic segmentation | 3.04% | training | 3.27% | representation | 2.95% |
| point cloud | 3.04% | semantic segmentation | 3.23% | training | 2.80% |
| attention | 2.84% | reconstruction | 3.19% | synthesis | 2.76% |
| adversarial | 2.75% | segmentation | 3.15% | feature | 2.58% |
| feature | 2.70% | graph | 3.06% | dataset | 2.58% |
| unsupervised | 2.60% | self supervis | 3.02% | object detection | 2.54% |
| training | 2.46% | feature | 3.02% | text to image | 2.21% |
| few shot | 2.36% | synthesis | 2.55% | generative | 2.21% |
| reconstruction | 2.36% | dataset | 2.55% | fusion | 2.14% |
| dataset | 2.36% | unsupervised | 2.47% | unsupervised | 2.10% |
| generation | 2.31% | adversarial | 2.42% | graph | 2.03% |
| prediction | 2.31% | resolution | 2.38% | point cloud | 1.99% |
| resolution | 2.31% | recognition | 2.25% | resolution | 1.95% |
| label | 2.27% | modeling | 2.25% | semantic segmentation | 1.92% |
| recognition | 2.27% | label | 2.17% | prediction | 1.88% |
| depth | 2.22% | prediction | 2.13% | adversarial | 1.88% |
| synthesis | 2.17% | semi supervised | 1.96% | editing | 1.88% |
| semi supervised | 2.03% | attention | 1.91% | zero shot | 1.84% |
| matching | 1.98% | few shot | 1.87% | attention | 1.80% |
| weakly supervised | 1.98% | localization | 1.87% | camera | 1.77% |
| contrastive learning | 1.98% | spars | 1.70% | multi modal | 1.77% |
| spars | 1.93% | weakly supervised | 1.66% | interaction | 1.69% |
| localization | 1.78% | space | 1.62% | spars | 1.69% |
| representation learning | 1.69% | representation learning | 1.62% | distillation | 1.66% |
| end to end | 1.64% | matching | 1.57% | benchmark | 1.66% |
| alignment | 1.64% | zero shot | 1.53% | self supervis | 1.51% |
| attack | 1.59% | generative | 1.49% | matching | 1.51% |
| transfer | 1.54% | generalization | 1.44% | rendering | 1.47% |
| camera | 1.45% | pre training | 1.44% | adaptation | 1.47% |
| generative | 1.40% | depth | 1.44% | recognition | 1.47% |
| space | 1.40% | rendering | 1.44% | few shot | 1.44% |
| classification | 1.30% | retrieval | 1.40% | modeling | 1.40% |
| cross modal | 1.25% | fusion | 1.40% | tuning | 1.40% |
| pre training | 1.25% | camera | 1.32% | depth | 1.40% |
| interaction | 1.21% | contrastive learning | 1.28% | alignment | 1.40% |
| generalization | 1.21% | alignment | 1.23% | latent | 1.36% |
| search | 1.21% | transfer | 1.23% | label | 1.36% |
| domain adaptation | 1.16% | benchmark | 1.23% | retrieval | 1.33% |
| modeling | 1.16% | attack | 1.23% | localization | 1.29% |
| wild | 1.16% | distillation | 1.19% | space | 1.25% |
| compression | 1.11% | adaptation | 1.19% | llm | 1.11% |
| rendering | 1.11% | cross modal | 1.15% | attack | 1.11% |
| re identification | 1.06% | tracking | 1.11% | transfer | 1.03% |
| embedding | 1.06% | latent | 1.11% | representation learning | 1.03% |
| tracking | 1.06% | editing | 1.11% | instruction | 1.03% |
| retrieval | 1.06% | embedding | 1.06% | generalization | 0.99% |
| instance segmentation | 1.01% | multi modal | 1.06% | pre training | 0.92% |
| zero shot | 1.01% | domain adaptation | 0.98% | weakly supervised | 0.92% |
| detector | 1.01% | language model | 0.98% | semi supervised | 0.92% |
| multi modal | 1.01% | grounding | 0.94% | tracking | 0.88% |
| fusion | 1.01% | regularization | 0.89% | image generation | 0.85% |
| distillation | 1.01% | quantization | 0.89% | grounding | 0.85% |
| benchmark | 0.96% | instance segmentation | 0.89% | enhancement | 0.81% |
| disentangl | 0.96% | action recognition | 0.85% | boosting | 0.81% |
| latent | 0.96% | interaction | 0.85% | reasoning | 0.81% |
| knowledge distillation | 0.96% | disentangl | 0.81% | embedding | 0.81% |
| clustering | 0.87% | restoration | 0.81% | federated learning | 0.77% |
| translation | 0.87% | clustering | 0.81% | disentangl | 0.77% |
| grounding | 0.87% | knowledge distillation | 0.81% | domain adaptation | 0.74% |
| captioning | 0.82% | wild | 0.81% | restoration | 0.74% |
| navigation | 0.82% | classification | 0.77% | contrastive learning | 0.74% |
| incremental learning | 0.82% | detector | 0.77% | end to end | 0.74% |
| restoration | 0.77% | text to image | 0.77% | 3d reconstruction | 0.70% |
| action recognition | 0.77% | compression | 0.77% | synthetic | 0.70% |
| quantization | 0.72% | continual learning | 0.72% | pruning | 0.66% |
| federated learning | 0.72% | tuning | 0.68% | clustering | 0.66% |
| adaptation | 0.72% | federated learning | 0.64% | video generation | 0.63% |
| regularization | 0.72% | reasoning | 0.64% | cross modal | 0.63% |
| object tracking | 0.72% | vision and language | 0.64% | navigation | 0.63% |
| variation | 0.68% | enhancement | 0.60% | continual learning | 0.59% |
| image generation | 0.68% | captioning | 0.60% | detector | 0.59% |
| classifier | 0.68% | end to end | 0.60% | knowledge distillation | 0.55% |
| regression | 0.68% | recovery | 0.60% | image classification | 0.55% |
| editing | 0.68% | translation | 0.55% | instance segmentation | 0.52% |
| reasoning | 0.63% | 3d reconstruction | 0.55% | re identification | 0.52% |
| diffusion | 0.63% | navigation | 0.55% | spatio temporal | 0.52% |
| boosting | 0.63% | image classification | 0.55% | quantization | 0.52% |
| synthetic | 0.58% | boosting | 0.55% | ||
| enhancement | 0.58% | synthetic | 0.55% | ||
| 3d reconstruction | 0.58% | re identification | 0.55% | ||
| correction | 0.53% | image generation | 0.51% | ||
| vision and language | 0.53% | ||||
| question answer | 0.53% | ||||
| continual learning | 0.53% | ||||
| noisy label | 0.53% | ||||
表3 論文出現キーワード推移(2022-2024年)
| 2019 | 2020 | 2021 | |||
|---|---|---|---|---|---|
| learning | 18.01% | learning | 17.05% | learning | 16.81% |
| video | 7.42% | 3d | 9.62% | 3d | 8.43% |
| 3d | 7.11% | video | 7.37% | video | 8.31% |
| adversarial | 5.80% | estimation | 5.94% | unsupervised | 4.64% |
| estimation | 5.02% | graph | 5.25% | object detection | 4.58% |
| detection | 4.56% | segmentation | 4.71% | estimation | 4.34% |
| feature | 4.41% | object detection | 4.30% | segmentation | 4.28% |
| graph | 4.25% | adversarial | 4.23% | graph | 3.92% |
| unsupervised | 4.10% | attention | 4.09% | detection | 3.80% |
| segmentation | 4.02% | detection | 3.68% | feature | 3.80% |
| attention | 3.48% | unsupervised | 3.55% | representation | 3.25% |
| object detection | 3.32% | feature | 3.48% | self supervis | 3.19% |
| recognition | 2.94% | recognition | 3.41% | point cloud | 2.89% |
| representation | 2.86% | representation | 3.21% | resolution | 2.89% |
| generative | 2.86% | search | 2.73% | adversarial | 2.83% |
| point cloud | 2.63% | reconstruction | 2.73% | depth | 2.71% |
| depth | 2.40% | resolution | 2.59% | label | 2.71% |
| semantic segmentation | 2.09% | point cloud | 2.59% | reconstruction | 2.59% |
| prediction | 2.01% | depth | 2.52% | recognition | 2.53% |
| reconstruction | 2.01% | training | 2.39% | space | 2.53% |
| domain adaptation | 2.01% | self supervis | 2.39% | generative | 2.35% |
| matching | 1.93% | prediction | 2.32% | semantic segmentation | 2.35% |
| re identification | 1.93% | domain adaptation | 2.05% | attention | 2.29% |
| embedding | 1.93% | generative | 2.05% | transformer | 2.23% |
| resolution | 1.86% | semantic segmentation | 1.91% | training | 2.23% |
| training | 1.78% | synthesis | 1.91% | domain adaptation | 2.23% |
| dataset | 1.78% | dataset | 1.84% | few shot | 2.23% |
| weakly supervised | 1.70% | attack | 1.84% | camera | 2.17% |
| tracking | 1.70% | space | 1.84% | generation | 2.11% |
| search | 1.55% | matching | 1.84% | semi supervised | 2.11% |
| end to end | 1.55% | few shot | 1.77% | synthesis | 2.11% |
| camera | 1.55% | label | 1.77% | search | 2.05% |
| synthesis | 1.55% | classification | 1.70% | prediction | 1.93% |
| transfer | 1.55% | semi supervised | 1.70% | localization | 1.75% |
| label | 1.47% | re identification | 1.57% | representation learning | 1.75% |
| zero shot | 1.47% | camera | 1.57% | re identification | 1.69% |
| captioning | 1.47% | transfer | 1.57% | weakly supervised | 1.69% |
| few shot | 1.39% | end to end | 1.50% | dataset | 1.63% |
| fusion | 1.39% | tracking | 1.50% | transfer | 1.57% |
| localization | 1.39% | compression | 1.43% | modeling | 1.45% |
| retrieval | 1.39% | weakly supervised | 1.43% | tracking | 1.45% |
| self supervis | 1.39% | reasoning | 1.43% | end to end | 1.45% |
| classification | 1.24% | embedding | 1.30% | embedding | 1.39% |
| action recognition | 1.24% | wild | 1.30% | matching | 1.39% |
| reasoning | 1.24% | representation learning | 1.30% | instance segmentation | 1.39% |
| instance segmentation | 1.24% | instance segmentation | 1.23% | alignment | 1.33% |
| question answer | 1.24% | spars | 1.09% | attack | 1.21% |
| metric learning | 1.16% | fusion | 1.09% | wild | 1.21% |
| generation | 1.16% | translation | 1.02% | cross modal | 1.21% |
| regression | 1.08% | disentangl | 1.02% | disentangl | 1.21% |
| attack | 1.08% | clustering | 1.02% | spars | 1.21% |
| compression | 1.08% | cross modal | 1.02% | latent | 1.21% |
| spars | 1.01% | zero shot | 0.96% | fusion | 1.15% |
| space | 1.01% | generation | 0.96% | detector | 1.15% |
| clustering | 1.01% | action recognition | 0.96% | retrieval | 1.15% |
| wild | 1.01% | localization | 0.96% | compression | 1.08% |
| disentangl | 1.01% | deep neural network | 0.89% | rendering | 1.08% |
| alignment | 0.93% | parsing | 0.89% | reasoning | 1.08% |
| benchmark | 0.93% | interaction | 0.89% | classification | 1.02% |
| regularization | 0.93% | retrieval | 0.89% | translation | 1.02% |
| translation | 0.93% | modeling | 0.89% | benchmark | 1.02% |
| representation learning | 0.93% | latent | 0.82% | object tracking | 1.02% |
| cross modal | 0.93% | alignment | 0.82% | interaction | 0.96% |
| semi supervised | 0.93% | multi modal | 0.82% | clustering | 0.96% |
| latent | 0.85% | reinforcement learning | 0.82% | generalization | 0.90% |
| interaction | 0.85% | face recognition | 0.82% | contrastive learning | 0.90% |
| variation | 0.85% | variation | 0.75% | face recognition | 0.84% |
| detector | 0.85% | rendering | 0.75% | adaptation | 0.84% |
| face recognition | 0.85% | detector | 0.75% | pre training | 0.72% |
| spatio temporal | 0.77% | transformer | 0.75% | grounding | 0.72% |
| parsing | 0.77% | spatio temporal | 0.75% | distillation | 0.72% |
| transfer learning | 0.77% | image classification | 0.68% | spatio temporal | 0.72% |
| image classification | 0.77% | captioning | 0.68% | restoration | 0.72% |
| adaptation | 0.77% | knowledge distillation | 0.68% | variation | 0.66% |
| deep neural network | 0.77% | editing | 0.68% | captioning | 0.66% |
| modeling | 0.70% | regularization | 0.61% | action recognition | 0.66% |
| navigation | 0.62% | regression | 0.61% | zero shot | 0.60% |
| inpainting | 0.54% | object tracking | 0.61% | style transfer | 0.60% |
| object tracking | 0.54% | adaptation | 0.55% | one shot | 0.60% |
| quantization | 0.54% | synthetic | 0.55% | correction | 0.60% |
| style transfer | 0.54% | meta learning | 0.55% | regression | 0.54% |
| correction | 0.54% | benchmark | 0.55% | classifier | 0.54% |
| grounding | 0.54% | quantization | 0.55% | incremental learning | 0.54% |
| pruning | 0.54% | pruning | 0.55% | regularization | 0.54% |
| generalization | 0.55% | navigation | 0.54% | ||
| image generation | 0.55% | editing | 0.54% | ||
表4 論文出現キーワード推移(2019-2021年)
| 2016 | 2017 | 2018 | |||
|---|---|---|---|---|---|
| learning | 13.38% | learning | 14.56% | learning | 19.51% |
| video | 8.55% | video | 8.69% | video | 9.30% |
| 3d | 6.38% | 3d | 6.26% | 3d | 7.35% |
| estimation | 5.91% | detection | 4.47% | adversarial | 6.44% |
| feature | 5.13% | estimation | 4.22% | estimation | 5.62% |
| detection | 4.98% | feature | 3.96% | feature | 4.80% |
| segmentation | 4.51% | segmentation | 3.96% | segmentation | 3.78% |
| recognition | 4.35% | recognition | 3.83% | generative | 3.57% |
| classification | 3.27% | camera | 2.94% | object detection | 3.57% |
| spars | 3.27% | depth | 2.68% | attention | 3.47% |
| object detection | 3.11% | classification | 2.55% | detection | 3.27% |
| representation | 2.64% | matching | 2.43% | re identification | 3.06% |
| label | 2.64% | space | 2.43% | depth | 3.06% |
| tracking | 2.64% | localization | 2.43% | unsupervised | 3.06% |
| matching | 2.49% | weakly supervised | 2.43% | weakly supervised | 2.76% |
| graph | 2.49% | attention | 2.30% | recognition | 2.66% |
| camera | 2.49% | graph | 2.17% | tracking | 2.55% |
| prediction | 2.33% | adversarial | 2.17% | matching | 2.55% |
| reconstruction | 2.33% | unsupervised | 2.17% | localization | 2.45% |
| training | 2.18% | action recognition | 2.17% | representation | 2.35% |
| dataset | 2.18% | representation | 2.04% | graph | 2.35% |
| space | 2.02% | tracking | 2.04% | resolution | 2.04% |
| localization | 2.02% | generative | 2.04% | synthesis | 2.04% |
| search | 2.02% | captioning | 2.04% | prediction | 2.04% |
| unsupervised | 1.87% | resolution | 2.04% | semantic segmentation | 2.04% |
| depth | 1.87% | regression | 1.92% | camera | 1.94% |
| re identification | 1.71% | object detection | 1.92% | question answer | 1.74% |
| action recognition | 1.71% | semantic segmentation | 1.92% | end to end | 1.74% |
| embedding | 1.56% | wild | 1.79% | point cloud | 1.63% |
| alignment | 1.56% | embedding | 1.79% | generation | 1.63% |
| regression | 1.56% | retrieval | 1.66% | reconstruction | 1.63% |
| semantic segmentation | 1.56% | prediction | 1.66% | domain adaptation | 1.63% |
| weakly supervised | 1.40% | re identification | 1.66% | embedding | 1.53% |
| descriptor | 1.40% | zero shot | 1.66% | spars | 1.53% |
| modeling | 1.40% | training | 1.53% | space | 1.43% |
| clustering | 1.24% | modeling | 1.41% | zero shot | 1.43% |
| resolution | 1.24% | dataset | 1.41% | classification | 1.43% |
| classifier | 1.24% | spatio temporal | 1.41% | dataset | 1.33% |
| attention | 1.09% | label | 1.41% | transfer | 1.23% |
| question answer | 1.09% | deep neural network | 1.41% | fusion | 1.23% |
| zero shot | 1.09% | question answer | 1.28% | action recognition | 1.23% |
| transfer | 1.09% | representation learning | 1.28% | regression | 1.23% |
| parsing | 1.09% | search | 1.28% | training | 1.23% |
| image classification | 1.09% | variation | 1.15% | captioning | 1.23% |
| deep neural network | 1.09% | reconstruction | 1.15% | modeling | 1.23% |
| light field | 1.09% | image classification | 1.15% | wild | 1.12% |
| latent | 0.93% | synthesis | 1.15% | disentangl | 1.12% |
| retrieval | 0.93% | cross modal | 1.15% | reinforcement learning | 1.02% |
| 3d reconstruction | 0.93% | spars | 1.15% | detector | 0.92% |
| captioning | 0.78% | low rank | 1.02% | alignment | 0.92% |
| benchmark | 0.78% | parsing | 1.02% | latent | 0.92% |
| detector | 0.78% | generation | 1.02% | self supervis | 0.92% |
| fusion | 0.78% | detector | 1.02% | deep neural network | 0.92% |
| wild | 0.78% | benchmark | 1.02% | retrieval | 0.92% |
| end to end | 0.78% | domain adaptation | 1.02% | label | 0.92% |
| labeling | 0.78% | end to end | 1.02% | translation | 0.92% |
| metric learning | 0.62% | light field | 0.89% | style transfer | 0.82% |
| object tracking | 0.62% | reinforcement learning | 0.89% | variation | 0.82% |
| non rigid | 0.62% | alignment | 0.89% | compression | 0.82% |
| recovery | 0.62% | metric learning | 0.89% | clustering | 0.82% |
| face recognition | 0.62% | descriptor | 0.89% | quantization | 0.82% |
| clustering | 0.89% | reasoning | 0.72% | ||
| fusion | 0.89% | face recognition | 0.72% | ||
| bayesian | 0.89% | 3d reconstruction | 0.72% | ||
| 3d reconstruction | 0.89% | light field | 0.72% | ||
| labeling | 0.89% | adaptation | 0.72% | ||
| face recognition | 0.77% | parsing | 0.61% | ||
| regularization | 0.77% | descriptor | 0.61% | ||
| recovery | 0.77% | interaction | 0.61% | ||
| transfer | 0.64% | transfer learning | 0.61% | ||
| one shot | 0.64% | non rigid | 0.51% | ||
| latent | 0.64% | benchmark | 0.51% | ||
| instance segmentation | 0.64% | synthetic | 0.51% | ||
| style transfer | 0.64% | attack | 0.51% | ||
| quantization | 0.64% | one shot | 0.51% | ||
| minimization | 0.64% | enhancement | 0.51% | ||
| classifier | 0.51% | restoration | 0.51% | ||
| reasoning | 0.51% | pruning | 0.51% | ||
| point cloud | 0.51% | classifier | 0.51% | ||
| self supervis | 0.51% | grounding | 0.51% | ||
| fine tuning | 0.51% | ||||
| object recognition | 0.51% | ||||
| object tracking | 0.51% | ||||
表5 論文出現キーワード推移(2016-2018年)
| 2014 | 2015 | ||
|---|---|---|---|
| learning | 9.44% | learning | 9.97% |
| segmentation | 6.67% | video | 7.81% |
| 3d | 6.67% | estimation | 6.81% |
| estimation | 6.11% | detection | 5.48% |
| video | 5.37% | 3d | 5.32% |
| tracking | 5.37% | feature | 5.32% |
| feature | 5.19% | recognition | 4.32% |
| recognition | 4.81% | segmentation | 4.32% |
| matching | 4.26% | matching | 3.49% |
| detection | 3.89% | spars | 3.49% |
| classification | 3.89% | graph | 3.49% |
| graph | 3.33% | tracking | 3.32% |
| depth | 3.15% | depth | 3.32% |
| modeling | 2.96% | camera | 3.32% |
| spars | 2.96% | representation | 3.16% |
| camera | 2.96% | retrieval | 2.66% |
| reconstruction | 2.78% | space | 2.49% |
| space | 2.78% | clustering | 2.33% |
| label | 2.22% | descriptor | 2.33% |
| representation | 2.22% | classification | 2.33% |
| search | 2.04% | object detection | 2.16% |
| parsing | 2.04% | search | 2.16% |
| 3d reconstruction | 1.85% | label | 2.16% |
| localization | 1.85% | reconstruction | 2.16% |
| action recognition | 1.85% | alignment | 1.83% |
| clustering | 1.67% | action recognition | 1.83% |
| unsupervised | 1.67% | localization | 1.83% |
| resolution | 1.67% | prediction | 1.66% |
| alignment | 1.48% | regression | 1.66% |
| labeling | 1.30% | dataset | 1.66% |
| object detection | 1.30% | low rank | 1.49% |
| non rigid | 1.11% | resolution | 1.49% |
| wild | 1.11% | image classification | 1.33% |
| weakly supervised | 0.93% | fusion | 1.33% |
| semi supervised | 0.93% | modeling | 1.33% |
| image classification | 0.93% | unsupervised | 1.16% |
| bayesian | 0.93% | metric learning | 1.16% |
| regression | 0.93% | transfer | 1.16% |
| object tracking | 0.93% | semantic segmentation | 1.16% |
| synthesis | 0.93% | re identification | 1.16% |
| variation | 0.93% | detector | 1.00% |
| enhancement | 0.93% | face recognition | 1.00% |
| object recognition | 0.74% | rgbd | 1.00% |
| descriptor | 0.74% | regularization | 1.00% |
| pedestrian detection | 0.74% | variation | 1.00% |
| prediction | 0.74% | parsing | 1.00% |
| transfer learning | 0.74% | embedding | 1.00% |
| minimization | 0.74% | bayesian | 0.83% |
| fusion | 0.74% | classifier | 0.83% |
| transfer | 0.74% | coarse to fine | 0.83% |
| recovery | 0.74% | deep neural network | 0.83% |
| retrieval | 0.74% | benchmark | 0.83% |
| low rank | 0.74% | light field | 0.83% |
| re identification | 0.56% | weakly supervised | 0.83% |
| boosting | 0.56% | wild | 0.83% |
| semantic segmentation | 0.56% | 3d reconstruction | 0.83% |
| dataset | 0.56% | labeling | 0.83% |
| spatio temporal | 0.56% | domain adaptation | 0.66% |
| quantization | 0.56% | non rigid | 0.66% |
| metric learning | 0.56% | multiple instance learning | 0.66% |
| domain adaptation | 0.56% | defocus | 0.66% |
| diffusion | 0.56% | semi supervised | 0.66% |
| correction | 0.66% | ||
| restoration | 0.66% | ||
表6 論文出現キーワード推移(2014-2015年)
* 今回より、出現キーワードの抽出方法を多少変更いたしました。
過去に公開したコラム内の出現キーワードとの順位相違や、新たなキーワードが追加されております。
■まとめ
今年も、CVPR2024開始前の予習的な意味合いで統計情報を先行してまとめ公開いたしました(2024年6月12日現在)。来週より始まるCVPR2024に現地・オンラインで参加される方の参考になれば嬉しい限りです。
● ResearchPortメンバーシップ募集:
https://research-p.com/?memberpage=registration
ResearchPortでは、研究者・技術者の方の研究事業開発サポートやキャリアサポートサービスを提供しております。ご興味がある方はResearchPortメンバーシップへご登録下さい。
編集:ResearchPort事業部
■Contact
本記事に関する質問や、ご意見・ご要望などがございましたらResearchPortまでお問い合わせください。
https://research-p.com/contactform/
-
2026年4月23日
「ICLR 2026」ResearchPortトップカンファレンス定点観測 vol.21